Measuring and improving our energy use
We're focused on reducing our energy use while serving the explosive growth of the Internet. Most data centersuse almost as much non-computing or “overhead” energy (like cooling and power conversion) as they do to power their servers. At Google we’ve reduced this overhead to only 12%. That way, most of the energy we use powers the machines directly serving Google searches and products. We take detailed measurements to continually push toward doing more with less—serving more users while wasting less energy.
We take the most comprehensive approach to measuring PUE
Our calculations include the performance of our entire fleet of data centers around the world—not just our newest and best facilities. We also continuously measure throughout the year—not just during cooler seasons.
Additionally, we include all sources of overhead in our efficiency metric. We could report much lower numbers if we took the loosest interpretation of the Green Grid's PUE measurement standards. In fact, our best site could boast a PUE of less than 1.06 if we used an interpretation commonly used in the industry. However, we're sticking to a higher standard because we believe it's better to measure and optimize everything on our site, not just part of it. Therefore, we report a comprehensive trailing twelve-month (TTM) PUE of 1.12 across all our data centers, in all seasons, including all sources of overhead.
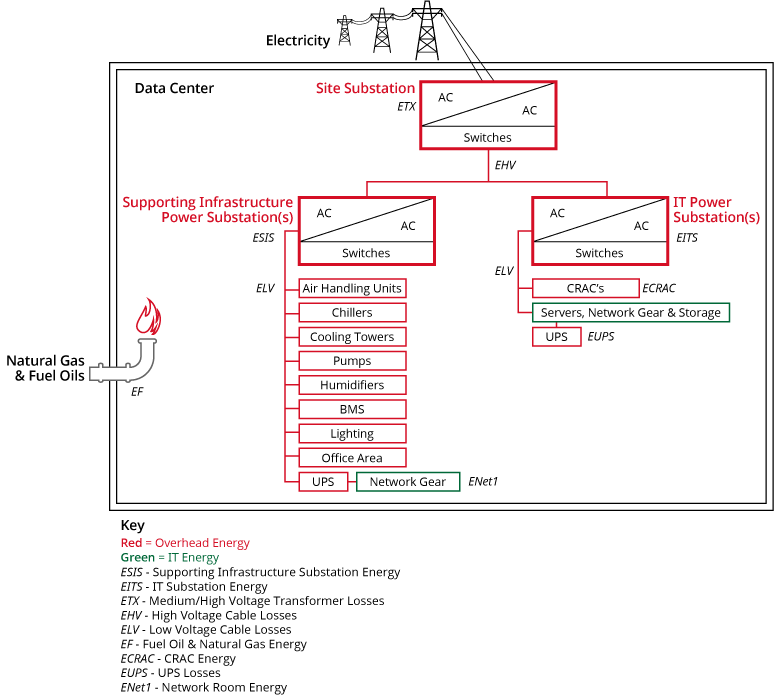
 Figure 1: Google data center PUE measurement boundaries. The average PUE for all Google data centers is 1.12, although we could boast a PUE as low as 1.06 when using narrower boundaries.
Google data center PUE performance
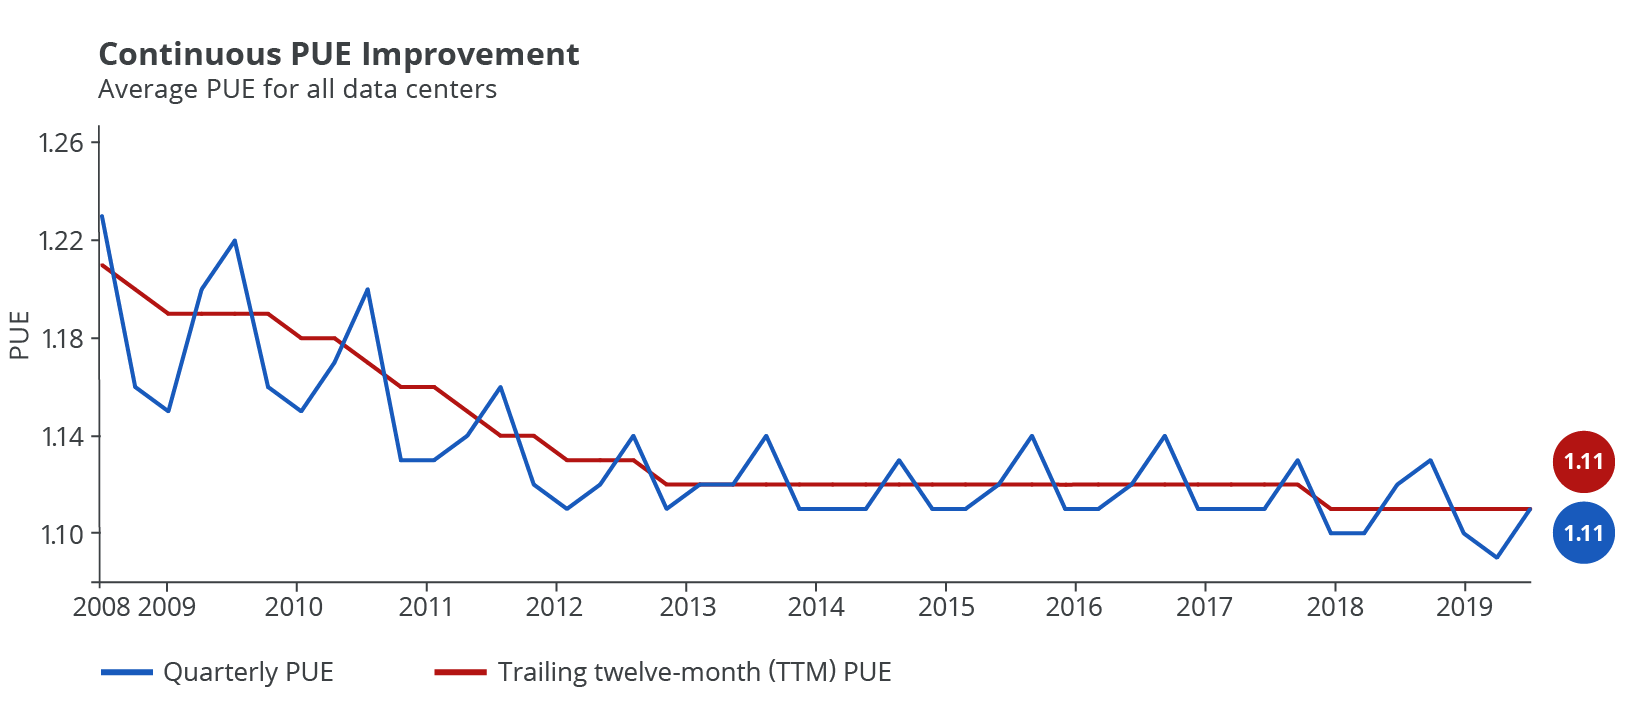
Our fleet-wide PUE has dropped significantly since we first started reporting our numbers in 2008. As of Q2 2014, the TTM energy-weighted average PUE for all Google data centers is 1.12, making our data centers among the most efficient in the world.

Figure 2: PUE data for all large-scale Google data centers
Q2 2014 performance
| Fleet-wide quarterly PUE: | 1.11 |
| Fleet-wide trailing twelve-month (TTM) PUE: | 1.12 |
| Individual facility minimum quarterly PUE: | 1.08, Data Center N |
| Individual facility minimum TTM PUE*: | 1.10, Data Centers J, L, N |
| Individual facility maximum quarterly PUE: | 1.14, Data Centers B, C, E, F |
| Individual facility maximum TTM PUE*: | 1.14, Data Centers B, F |
* We report Individual Facility TTM PUE only for facilities with at least twelve months of operation.
Details:
For Q2, our fleet-wide quarterly PUE was 1.11, and our fleet-wide TTM PUE was 1.12. These are the same as the previous quarter's results.
In Q2, we had five sites reporting quarterly PUEs of 1.10 or less. Three sites had TTM PUEs of 1.10 or less in the same period.
Measurement FAQs
What's the average PUE of other data centers?
According to the Uptime Institute's 2014 Data Center Survey, the global average of respondents' largest data centers is around 1.7.
Why does our data vary?
Our facilities have different power and cooling infrastructures, and are located in different climates. Seasonal weather patterns also impact PUE values, which is why they tend to be lower during cooler quarters. We’ve managed to maintain a low PUE average across our entire fleet of data center sites around the world—even during hot, humid Atlanta summers.
How do we get our PUE data?
We use multiple on-line power meters in our data centers to measure power consumption over time. We track the energy used by our cooling infrastructure and IT equipment on separate meters, giving us very accurate PUE calculations. We account for all of our power-consuming elements in our PUE by using dozens or even hundreds of power meters in our facilities.
What do we include in our calculations?
When measuring our IT equipment power, we include only the servers, storage, and networking equipment. We consider everything else overhead power. For example, we include electrical losses from a server's power cord as overhead, not as IT power. Similarly, we measure total utility power at the utility side of the substation, and therefore include substation transformer losses in our PUE.
 Figure 3: Google includes servers, storage, and networking equipment as IT equipment power. We consider everything else overhead power.
Equation for PUE for our data centers

ESIS Energy consumption for supporting infrastructure power substations feeding the cooling plant, lighting, office space, and some network equipment
EITS Energy consumption for IT power substations feeding servers, network, storage, and computer room air conditioners (CRACs)
ETX Medium and high voltage transformer losses
EHV High voltage cable losses
ELV Low voltage cable losses
EF Energy consumption from on-site fuels including natural gas & fuel oils
ECRAC CRAC energy consumption
EUPS Energy loss at uninterruptible power supplies (UPSes) which feed servers, network, and storage equipment
ENet1 Network room energy fed from type 1 unit substitution
We’re driving the industry forward
We’ve made continual improvements since we first disclosed our efficiency data in 2008. As we've shared the lessons we’ve learned, we're happy to see a growing number of highly efficient data centers. But this is just the beginning. Through our best practices and case studies, we continue to share what we’ve learned to help data centers of any size run more efficiently.
Comments
Post a Comment